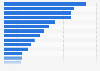
The largest share of job postings on Headhunter in Russia in 2018, measuring at 36 percent, required information technology (IT) specialists to have four to six years of professional experience. Nine percent of the vacancies in the IT sector were entry-level, open to the applicants who worked for less than one year.
Distribution of vacancies in the information technology (IT) sector in Russia in 2018, by required years of experience
Basic Account
Get to know the platform
You only have access to basic statistics.
This statistic is not included in your account.
Starter Account
The ideal entry-level account for individual users
- Instant access to 1m statistics
- Download in XLS, PDF & PNG format
- Detailed references
$199 USD / Month *
Professional Account
Full access
Business Solutions including all features.
* Prices do not include sales tax.
Other statistics that may interest you Statistics on
About the industry
10
- Basic Statistic IT-intensive jobs share in Russia 2018, by sector and type
- Basic Statistic Share of IT specialists in Russia in 2021, by age
- Basic Statistic IT-intensive jobs share in Russia 2018, by sector
- Basic Statistic Share of ICT employees in Russia 2018, by age and sector
- Basic Statistic Share of IT specialists in Russia in 2018, by qualification
- Premium Statistic Number of IT specialists in Russia in 2021, by position
- Basic Statistic Share of IT specialists in Russia in 2018, by sector
- Premium Statistic Completed IT certificates among high tech employees in Vietnam 2018
- Premium Statistic Canadian IT employment numbers 2015-2020
- Premium Statistic Jobs generated by cloud computing in Canada 2015-2020
About the region
10
- Premium Statistic IT salary expectations in Russia 2021, by experience and region
- Premium Statistic IT companies' sales revenue in Russia 2013-2022
- Premium Statistic Share of ICT fixed capital investment in Russia 2021, by asset
- Premium Statistic ICT goods and services export growth index in Russia 2010-2021
- Premium Statistic Import value of ICT services in Russia 2014-2022, by type
- Premium Statistic Share of ICT services import volume in Russia 2015-2021, by type
- Premium Statistic Share of ICT services export volume in Russia 2015-2021, by type
- Premium Statistic Digital technologies developed by Russian IT providers in 2018
- Premium Statistic Kaspersky Lab's revenue worldwide 2016-2022
- Basic Statistic ICT services export value in Russia 2008-2022, by type
Other regions
10
- Premium Statistic Outcomes for organizations after ransom payments worldwide 2023
- Premium Statistic New technologies applied by enterprises in Vietnam 2018, by type
- Premium Statistic Italy: salaries of SAP ERP specialists by occupation and city 2017
- Premium Statistic Individuals studying ICT technologies in Poland 2014-2023
- Premium Statistic Top European medtech ventures by gross raised 2020-2021
- Premium Statistic State government IT budget in the U.S. 2010-2020
- Premium Statistic IT services spending in Latin America 2015-2020
- Premium Statistic IT students funded by government in Australia 2015-2017, by qualification
- Premium Statistic Tech access while working from home during COVID-19 in Mexico 2020
- Premium Statistic IT services spending in Middle East and Africa 2014-2020
Related statistics
10
- Premium Statistic IT services revenue in Russia 2016-2021
- Basic Statistic Most popular jobs among men in Russia in 2022
- Basic Statistic Most popular jobs among women in Russia in 2022
- Premium Statistic PaaS market volume in Russia 2013-2022
- Premium Statistic Software industry revenue in Russia 2013-2022, by market
- Premium Statistic Software sales distribution in Russia 2013-2022, by market
- Premium Statistic Russian software companies' presence abroad 2022, by region
- Premium Statistic Software sales share of Russian companies 2022, by region
- Premium Statistic IT market size in Russia 2013-2022
- Premium Statistic Share of IT industry patents filed by Russia in 2020, by sector
Further related statistics
2
Further Content: You might find this interesting as well
Yandex. (April 23, 2019). Distribution of vacancies in the information technology (IT) sector in Russia in 2018, by required years of experience [Graph]. In Statista. Retrieved June 05, 2024, from https://www.statista.com/statistics/1038622/russia-it-vacancies-distribution-by-experience/
Yandex. "Distribution of vacancies in the information technology (IT) sector in Russia in 2018, by required years of experience." Chart. April 23, 2019. Statista. Accessed June 05, 2024. https://www.statista.com/statistics/1038622/russia-it-vacancies-distribution-by-experience/
Yandex. (2019). Distribution of vacancies in the information technology (IT) sector in Russia in 2018, by required years of experience. Statista. Statista Inc.. Accessed: June 05, 2024. https://www.statista.com/statistics/1038622/russia-it-vacancies-distribution-by-experience/
Yandex. "Distribution of Vacancies in The Information Technology (It) Sector in Russia in 2018, by Required Years of Experience." Statista, Statista Inc., 23 Apr 2019, https://www.statista.com/statistics/1038622/russia-it-vacancies-distribution-by-experience/
Yandex, Distribution of vacancies in the information technology (IT) sector in Russia in 2018, by required years of experience Statista, https://www.statista.com/statistics/1038622/russia-it-vacancies-distribution-by-experience/ (last visited June 05, 2024)
Distribution of vacancies in the information technology (IT) sector in Russia in 2018, by required years of experience [Graph], Yandex, April 23, 2019. [Online]. Available: https://www.statista.com/statistics/1038622/russia-it-vacancies-distribution-by-experience/