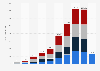
P type nanosilica is forecast to have a market volume amounting to a total of 386,300 metric tons in the United States in 2025. The U.S. nanosilica market size is expected to grow in the coming years due to increasing demand from rubber manufacturing for the automotive industry.
Market volume forecast of nanosilica in the United States from 2020 to 2025, by product (in 1,000 metric tons)
Basic Account
Get to know the platform
You only have access to basic statistics.
This statistic is not included in your account.
Starter Account
The ideal entry-level account for individual users
- Instant access to 1m statistics
- Download in XLS, PDF & PNG format
- Detailed references
$199 USD / Month *
Professional Account
Full access
Business Solutions including all features.
* Prices do not include sales tax.
Other statistics that may interest you Statistics on
About the industry
9
- Premium Statistic U.S. nanosilica market volume 2014-2025
- Premium Statistic U.S. gold nanoparticles market size 2014-2025
- Premium Statistic U.S. gold nanoparticles market size forecast by end use 2020-2025
- Premium Statistic U.S. sulfur production volume 2014-2023
- Basic Statistic Global leading synthetic graphite importing countries 2022
- Premium Statistic U.S. self-healing ceramic market value 2017-2025
- Premium Statistic Global market value of tungsten carbide 2017 & 2028
- Basic Statistic Global market value of hydrogen technologies 2022-2027
- Premium Statistic Global thermoplastic polyurethane market size 2021-2030
About the region
10
- Premium Statistic U.S. soda ash market value 2012-2024
- Premium Statistic U.S. soda ash market value forecast by application 2020-2024
- Premium Statistic U.S. automotive glass market revenue 2014-2025
- Premium Statistic Diamond imports to the U.S. 2010-2020
- Premium Statistic Diamonds export value in the U.S. 2010-2020
- Basic Statistic U.S. salt production by product format 2015-2019
- Basic Statistic U.S. salt production by type 2012-2019
- Premium Statistic Average U.S. price of construction sand and gravel 2010-2023
- Premium Statistic Production index of the nonmetallic mineral mining industry in the U.S. 2017-2023
- Premium Statistic U.S. asbestos consumption volume 2011-2022
Other regions
10
- Premium Statistic Global automotive glass market value 2019-2027
- Premium Statistic Global market value of ceramic mosaic tiles 2022-2030
- Basic Statistic Production value of glass containers in Taiwan 2010-2021
- Premium Statistic Colombia: share of tire imports 2017, by company
- Premium Statistic Advertising spending in Sweden 2017, by industry sector
- Premium Statistic Advertising spending in Portugal 2017, by industry sector
- Premium Statistic Advertising spending in Norway 2017, by industry sector
- Premium Statistic Advertising spending in Switzerland 2017, by industry sector
- Premium Statistic UK: monthly value of natural graphite exports 2017-2018
- Premium Statistic Italy: change of production value of refractory products manufacturers 2015-2017
Related statistics
10
- Premium Statistic European tire and rubber manufacturing companies 2010-2020
- Premium Statistic Tire and rubber manufacturing sector turnover in the EU 2010-2020
- Premium Statistic Tire production within the European Union (EU) 2010-2020
- Premium Statistic European heavy and light vehicle tire sales 2012-2020
- Premium Statistic European motorcycle tire imports and exports volume 2002-2020
- Premium Statistic Import value of tires to the EU 2010-2020
- Premium Statistic Export value of tires from the European Union 2010-2020
- Premium Statistic Passenger vehicle tire imports and exports from the EU 2001-2020
- Premium Statistic Truck tire imports and exports in the EU 2001-2020
- Premium Statistic EU tire and rubber manufacturers direct employment 2010-2020
Further Content: You might find this interesting as well
Statistics
Statista. (August 12, 2019). Market volume forecast of nanosilica in the United States from 2020 to 2025, by product (in 1,000 metric tons) [Graph]. In Statista. Retrieved May 13, 2024, from https://www.statista.com/statistics/1039869/us-nanosilica-market-size-by-product/
Statista. "Market volume forecast of nanosilica in the United States from 2020 to 2025, by product (in 1,000 metric tons)." Chart. August 12, 2019. Statista. Accessed May 13, 2024. https://www.statista.com/statistics/1039869/us-nanosilica-market-size-by-product/
Statista. (2019). Market volume forecast of nanosilica in the United States from 2020 to 2025, by product (in 1,000 metric tons). Statista. Statista Inc.. Accessed: May 13, 2024. https://www.statista.com/statistics/1039869/us-nanosilica-market-size-by-product/
Statista. "Market Volume Forecast of Nanosilica in The United States from 2020 to 2025, by Product (in 1,000 Metric Tons)." Statista, Statista Inc., 12 Aug 2019, https://www.statista.com/statistics/1039869/us-nanosilica-market-size-by-product/
Statista, Market volume forecast of nanosilica in the United States from 2020 to 2025, by product (in 1,000 metric tons) Statista, https://www.statista.com/statistics/1039869/us-nanosilica-market-size-by-product/ (last visited May 13, 2024)
Market volume forecast of nanosilica in the United States from 2020 to 2025, by product (in 1,000 metric tons) [Graph], Statista, August 12, 2019. [Online]. Available: https://www.statista.com/statistics/1039869/us-nanosilica-market-size-by-product/