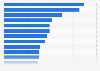
A survey of Indonesian women conducted in 2019 found that the majority of Gen Y and Gen Z respondents preferred to buy cosmetic products from retail pharmacies and e-commerce sites. By comparison, the majority of Gen X respondents preferred to go to an official retail outlet to purchase make-up.
Preferred purchase channels among Indonesian women for make-up, beauty, and hair products as of September 2019, by age group
Basic Account
Get to know the platform
You only have access to basic statistics.
This statistic is not included in your account.
Starter Account
The ideal entry-level account for individual users
- Instant access to 1m statistics
- Download in XLS, PDF & PNG format
- Detailed references
$199 USD / Month *
Professional Account
Full access
Business Solutions including all features.
* Prices do not include sales tax.
Other statistics that may interest you Statistics on
About the industry
10
- Premium Statistic Information sources on make-up products among women Indonesia 2019 by age group
- Premium Statistic Breakdown of skincare routines Indonesia 2019 by steps and time of day
- Premium Statistic Skincare products used by male respondents in Indonesia 2021, by origin
- Premium Statistic Share of K- beauty products out of beauty products of Indonesian respondents 2021
- Premium Statistic Share of K- beauty products out of beauty products of Singaporean respondents 2021
- Premium Statistic Share of K- beauty products among Indonesian female respondents 2021
- Premium Statistic Skincare products used by female respondents in Malaysia 2021 by origin
- Premium Statistic Skincare products used by male respondents in Malaysia 2021 by origin
- Premium Statistic Share of K- beauty products out of beauty products of Malaysian respondents 2021
- Premium Statistic Share of K- beauty products among Malaysian female respondents 2021
About the region
10
- Premium Statistic Frequency of not using make up in a week among women Indonesia 2019
- Premium Statistic Average time spent daily applying make-up among women Indonesia 2019 by age group
- Premium Statistic Skincare products used by female respondents in Indonesia 2021, by origin
- Premium Statistic Favorite make-up product among women Indonesia 2019 by age group
- Premium Statistic Most visited beauty salons among women Indonesia 2019 by age group
- Premium Statistic Women's preferred skincare product functions Indonesia 2019 by age group
- Premium Statistic Leading factors when choosing female skincare products Indonesia 2019 by age group
- Premium Statistic Familiarity with skincare ingredients among women Indonesia 2019 by age group
- Premium Statistic Must have skincare products among women Indonesia 2019 by age group
- Premium Statistic Export value of beauty or makeup and skin care preparations Indonesia 2022 by country
Selected statistics
1
Other regions
10
- Premium Statistic Skincare products used by female respondents in Singapore 2021 by origin
- Premium Statistic Women who bought health and beauty products Australia 2018 by place of purchase
- Premium Statistic Products purchased to treat sensitive body skin by women in France 2018
- Basic Statistic Global scar treatment market size 2017 and 2023
- Premium Statistic Reasons U.S. consumers shop for cosmetics at Target and Macy's 2016, by retailer
- Premium Statistic Peru: facial care market size 2019-2022
- Premium Statistic Czech Republic: recent purchase channels 2015
- Premium Statistic Cosmetics imports market share in Taiwan 2016, by exporter
- Premium Statistic Advertising luxury by over 35 year old in GCC by social media platform 2016
- Premium Statistic Austria: purchase channels after in-store research 2014
Related statistics
10
- Premium Statistic Import value of beauty or makeup and skin care preparations Indonesia 2022 by country
- Premium Statistic Reasons for not using K-beauty products among male respondents Indonesia 2021
- Premium Statistic Information sources on K-beauty trends Indonesia 2021
- Premium Statistic Information sources for female respondents on K-beauty trends Indonesia 2021
- Premium Statistic Information sources for male respondents on K-beauty trends Indonesia 2021
- Premium Statistic Skincare products used by respondents in Indonesia 2021 by origin
- Premium Statistic Factors influencing consumers to try K-beauty products Indonesia 2021
- Premium Statistic Share of K- beauty products from beauty products of Indonesian male respondents 2021
- Premium Statistic Factors influencing female consumers to try K-beauty products Indonesia 2021
- Premium Statistic Reasons for using K-beauty products Indonesia 2021
Further related statistics
8
- Revenue of the cosmetic & beauty industry in the U.S. 2002-2022
- Reasons for not buying books in bookstores in France 2023
- U.S. population without health care visits 1997-2018, by gender
- Consumer electronics: Online purchasing in Great Britain 2020, by demographic
- Computer software: Online purchasing in Great Britain 2020, by age group
- Mobile internet use via laptops in Great Britain 2019, by demographic
- Adults with severe headache or migraine 1997-2016, by gender
- Consumers' likelihood of choosing soft drinks in the UK 2012, by gender
Further Content: You might find this interesting as well
Statistics
- Revenue of the cosmetic & beauty industry in the U.S. 2002-2022
- Reasons for not buying books in bookstores in France 2023
- U.S. population without health care visits 1997-2018, by gender
- Consumer electronics: Online purchasing in Great Britain 2020, by demographic
- Computer software: Online purchasing in Great Britain 2020, by age group
- Mobile internet use via laptops in Great Britain 2019, by demographic
- Adults with severe headache or migraine 1997-2016, by gender
- Consumers' likelihood of choosing soft drinks in the UK 2012, by gender
ZAP Clinic. (January 21, 2020). Preferred purchase channels among Indonesian women for make-up, beauty, and hair products as of September 2019, by age group [Graph]. In Statista. Retrieved May 13, 2024, from https://www.statista.com/statistics/1115913/indonesia-preferred-places-to-buy-make-up-products-by-age-group/
ZAP Clinic. "Preferred purchase channels among Indonesian women for make-up, beauty, and hair products as of September 2019, by age group." Chart. January 21, 2020. Statista. Accessed May 13, 2024. https://www.statista.com/statistics/1115913/indonesia-preferred-places-to-buy-make-up-products-by-age-group/
ZAP Clinic. (2020). Preferred purchase channels among Indonesian women for make-up, beauty, and hair products as of September 2019, by age group. Statista. Statista Inc.. Accessed: May 13, 2024. https://www.statista.com/statistics/1115913/indonesia-preferred-places-to-buy-make-up-products-by-age-group/
ZAP Clinic. "Preferred Purchase Channels among Indonesian Women for Make-up, Beauty, and Hair Products as of September 2019, by Age Group." Statista, Statista Inc., 21 Jan 2020, https://www.statista.com/statistics/1115913/indonesia-preferred-places-to-buy-make-up-products-by-age-group/
ZAP Clinic, Preferred purchase channels among Indonesian women for make-up, beauty, and hair products as of September 2019, by age group Statista, https://www.statista.com/statistics/1115913/indonesia-preferred-places-to-buy-make-up-products-by-age-group/ (last visited May 13, 2024)
Preferred purchase channels among Indonesian women for make-up, beauty, and hair products as of September 2019, by age group [Graph], ZAP Clinic, January 21, 2020. [Online]. Available: https://www.statista.com/statistics/1115913/indonesia-preferred-places-to-buy-make-up-products-by-age-group/