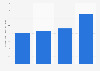
The graph shows a forecast for the worldwide distribution of travel spending by region for 2020, compared to 2008. 32% of total spending made by tourists in 2020 is expected to be in Asia.
Projected distribution of the world's travel spending by region in 2020 compared with 2008
Basic Account
Get to know the platform
You only have access to basic statistics.
This statistic is not included in your account.
Starter Account
The ideal entry-level account for individual users
- Instant access to 1m statistics
- Download in XLS, PDF & PNG format
- Detailed references
$199 USD / Month *
Professional Account
Full access
Business Solutions including all features.
* Prices do not include sales tax.
Other statistics that may interest you Tourism worldwide
Overview
8
- Basic Statistic Total contribution of travel and tourism to GDP worldwide 2019-2033
- Basic Statistic Travel and tourism: share of global GDP 2019-2033
- Basic Statistic Leading global travel markets by travel and tourism contribution to GDP 2019-2022
- Basic Statistic Global leisure travel spend 2019-2022
- Premium Statistic Global business travel spending 2001-2022
- Premium Statistic Number of international tourist arrivals worldwide 1950-2023
- Basic Statistic Number of international tourist arrivals worldwide 2005-2023, by region
- Basic Statistic Travel and tourism employment worldwide 2019-2033
Hotels
6
- Premium Statistic Global hotel and resort industry market size worldwide 2013-2023
- Premium Statistic Most valuable hotel brands worldwide 2023, by brand value
- Basic Statistic Leading hotel companies worldwide 2023, by number of properties
- Premium Statistic Hotel openings worldwide 2021-2024
- Premium Statistic Hotel room openings worldwide 2021-2024
- Premium Statistic Countries with the most hotel construction projects in the pipeline worldwide 2022
Transport
7
- Premium Statistic Airports with the most international air passenger traffic worldwide 2022
- Premium Statistic Market value of selected airlines worldwide 2023
- Premium Statistic Global passenger rail users forecast 2017-2027
- Premium Statistic Daily ridership of bus rapid transit systems worldwide by region 2023
- Premium Statistic Number of users of car rentals worldwide 2019-2028
- Premium Statistic Number of users in selected countries in the Car Rentals market in 2023
- Premium Statistic Carbon footprint of international tourism transport worldwide 2005-2030, by type
Attractions
4
- Premium Statistic Leading museums by highest attendance worldwide 2019-2022
- Basic Statistic Most visited amusement and theme parks worldwide 2019-2022
- Basic Statistic Monuments on the UNESCO world heritage list 2023, by type
- Basic Statistic Selected countries with the most Michelin-starred restaurants worldwide 2023
Online travel market
6
- Premium Statistic Online travel market size worldwide 2017-2028
- Premium Statistic Estimated desktop vs. mobile revenue of leading OTAs worldwide 2023
- Premium Statistic Number of aggregated downloads of leading online travel agency apps worldwide 2023
- Basic Statistic Market cap of leading online travel companies worldwide 2023
- Premium Statistic Estimated EV/Revenue ratio in the online travel market 2024, by segment
- Premium Statistic Estimated EV/EBITDA ratio in the online travel market 2024, by segment
Selected trends
6
- Premium Statistic Global travelers who believe in the importance of green travel 2023
- Premium Statistic Sustainable initiatives travelers would adopt worldwide 2022, by region
- Premium Statistic Airbnb revenue worldwide 2017-2023
- Premium Statistic Airbnb nights and experiences booked worldwide 2017-2023
- Premium Statistic Technologies global hotels plan to implement in the next three years 2022
- Premium Statistic Hotel technologies global consumers think would improve their future stay 2022
Outlook
4
- Premium Statistic Travel and tourism revenue worldwide 2019-2028, by segment
- Premium Statistic Distribution of sales channels in the travel and tourism market worldwide 2018-2028
- Premium Statistic Inbound tourism visitor growth worldwide 2020-2025, by region
- Premium Statistic Outbound tourism visitor growth worldwide 2020-2025, by region
Further related statistics
10
- Change in number of visitors from Mexico to the U.S. 2018-2024
- Foreign exchange earnings from tourism in India 2000-2022
- Consumer expenditure on photo studios in the U.S. 1999-2013
- Consumer expenditure on live entertainment in the U.S. 1999-2013
- Countries with the highest number of inbound tourist arrivals worldwide 2019-2023
- Number of international tourist arrivals in India 2010-2021
- Consumer expenditure on video and audio equipment in the U.S. 1999-2019
- Cruise sector: direct expenditures in Europe 2017, by country
- Passenger traffic at Dubai Airports from 2010 to 2020*
- Global pharmaceutical pipeline by therapy area 2013-2017
Further Content: You might find this interesting as well
Statistics
- Change in number of visitors from Mexico to the U.S. 2018-2024
- Foreign exchange earnings from tourism in India 2000-2022
- Consumer expenditure on photo studios in the U.S. 1999-2013
- Consumer expenditure on live entertainment in the U.S. 1999-2013
- Countries with the highest number of inbound tourist arrivals worldwide 2019-2023
- Number of international tourist arrivals in India 2010-2021
- Consumer expenditure on video and audio equipment in the U.S. 1999-2019
- Cruise sector: direct expenditures in Europe 2017, by country
- Passenger traffic at Dubai Airports from 2010 to 2020*
- Global pharmaceutical pipeline by therapy area 2013-2017
Oxford Economics, & Amadeus. (November 10, 2010). Projected distribution of the world's travel spending by region in 2020 compared with 2008 [Graph]. In Statista. Retrieved June 13, 2024, from https://www.statista.com/statistics/270424/forecast-for-worldwide-travel-spending-by-region-in-2020/
Oxford Economics, und Amadeus. "Projected distribution of the world's travel spending by region in 2020 compared with 2008." Chart. November 10, 2010. Statista. Accessed June 13, 2024. https://www.statista.com/statistics/270424/forecast-for-worldwide-travel-spending-by-region-in-2020/
Oxford Economics, Amadeus. (2010). Projected distribution of the world's travel spending by region in 2020 compared with 2008. Statista. Statista Inc.. Accessed: June 13, 2024. https://www.statista.com/statistics/270424/forecast-for-worldwide-travel-spending-by-region-in-2020/
Oxford Economics, and Amadeus. "Projected Distribution of The World's Travel Spending by Region in 2020 Compared with 2008." Statista, Statista Inc., 10 Nov 2010, https://www.statista.com/statistics/270424/forecast-for-worldwide-travel-spending-by-region-in-2020/
Oxford Economics & Amadeus, Projected distribution of the world's travel spending by region in 2020 compared with 2008 Statista, https://www.statista.com/statistics/270424/forecast-for-worldwide-travel-spending-by-region-in-2020/ (last visited June 13, 2024)
Projected distribution of the world's travel spending by region in 2020 compared with 2008 [Graph], Oxford Economics, & Amadeus, November 10, 2010. [Online]. Available: https://www.statista.com/statistics/270424/forecast-for-worldwide-travel-spending-by-region-in-2020/