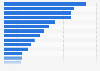
New standard occupations in the United States in 2012
This statistic illustrates the annual mean wage of 15 occupations that were newly identified by the 2010 Standard Occupational Classification System in 2013. The annual mean wage of web developers is 66,100 dollars.