Methanol - statistics & facts
Key insights
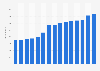
- Global methanol market size
- 37.04bn USD

Detailed statistics
Global methanol market size 2021-2030
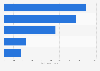
- Leading methanol exporter
- Saudi Arabia

Detailed statistics
Export value of methanol worldwide in 2021, by country
- Leading methanol importer
- China

Detailed statistics
Import value of methanol worldwide in 2021, by country
Editor’s Picks Current statistics on this topic
Current statistics on this topic


Related topics
Other interesting statistics
-
Basic Statistic
Renewable energy capacity in Latin America and the Caribbean 2023, by country

Renewable energy capacity in Latin America and the Caribbean 2023, by country
Leading countries based on renewable energy capacity in Latin America and the Caribbean in 2023 (in megawatts)
-
Premium Statistic
Final energy consumption of renewable municipal waste in CEE 2020-2022

Final energy consumption of renewable municipal waste in CEE 2020-2022
Final energy consumption of renewable municipal waste in Central and Eastern European countries from 2020 to 2022 (in kilotonnes of oil equivalent)
-
Premium Statistic
Primary energy production of renewable municipal waste in CEE 2020-2022

Primary energy production of renewable municipal waste in CEE 2020-2022
Primary energy production of renewable municipal waste in Central and Eastern European countries from 2020 to 2022 (in kilotonnes of oil equivalent)
-
Premium Statistic
Global renewable energy consumption 2022, by country

Global renewable energy consumption 2022, by country
Leading countries by renewable energy consumption worldwide in 2022 (in exajoules)
-
Premium Statistic
Renewable energy capacity in Latin America and the Caribbean 2010-2023

Renewable energy capacity in Latin America and the Caribbean 2010-2023
Renewable energy capacity in Latin America and the Caribbean from 2010 to 2023 (in gigawatts)
-
Basic Statistic
Fossil fuel and renewable energy consumption in the U.S. 2000-2022

Fossil fuel and renewable energy consumption in the U.S. 2000-2022
Energy consumption from fossil fuels and renewables in the United States from 2000 to 2022 (in quadrillion British thermal units)
-
Premium Statistic
Installed renewable energy capacity India 2024, by sector

Installed renewable energy capacity India 2024, by sector
Installed renewable energy capacity in India as of February 2024, by sector (in megawatts)
-
Premium Statistic
Renewable energy generation China 2013-2021

Renewable energy generation China 2013-2021
Total renewable energy generated in China from 2013 to 2021 (in terawatt hours)
-
Premium Statistic
Renewable energy installations power installed in Poland 2021-2023

Renewable energy installations power installed in Poland 2021-2023
Power installed in renewable energy installations in Poland from July 2021 to December 2023 (in megawatt)
-
Premium Statistic
Renewable energy source electricity generation in Poland 2021-2023

Renewable energy source electricity generation in Poland 2021-2023
Electric power production in renewable energy installations in Poland from July 2021 to December 2023 (in gigawatt-hours)
-
Premium Statistic
Renewable energy share in the Deutsche Bahn AG traction current 2013-2024

Renewable energy share in the Deutsche Bahn AG traction current 2013-2024
Share of renewable energy in the Deutsche Bahn AG traction current from 2013 to 2024
-
Premium Statistic
Commercial renewable energy projects Philippines 2023, by source

Commercial renewable energy projects Philippines 2023, by source
Number of commercial renewable energy projects in the Philippines as of December 2023, by source
-
Premium Statistic
Renewable energy supply share in Germany in 2013 and 2023, by sector

Renewable energy supply share in Germany in 2013 and 2023, by sector
Share of renewable energy in energy supply in Germany in 2013 and 2023, by sector
-
Premium Statistic
Type of renewable energy source used in enterprises in Poland 2023

Type of renewable energy source used in enterprises in Poland 2023
What type of renewable energy source (RES) is used in your enterprise?
-
Premium Statistic
Renewable energy projects for private use Philippines 2023, by source

Renewable energy projects for private use Philippines 2023, by source
Number of renewable energy projects for private usage in the Philippines as of December 2023, by source
-
Basic Statistic
Final energy consumption from renewable energy in the heating sector in Germany 2023

Final energy consumption from renewable energy in the heating sector in Germany 2023
Final energy consumption from renewable energy in the heating sector in Germany in 2023, by energy carrier (in terawatt hours)
-
Premium Statistic
Investments in renewable energy plants by source in Germany 2023

Investments in renewable energy plants by source in Germany 2023
Investments in renewable energy plants in Germany in 2023, by energy source (in billion euros)
-
Premium Statistic
Global renewable energy production from the ocean 2010-2021, by technology

Global renewable energy production from the ocean 2010-2021, by technology
Total renewable energy generation from the ocean worldwide from 2010 to 2021, by technology (in gigawatt hours)
-
Premium Statistic
Investments in renewable energy plants in Germany 2001-2023

Investments in renewable energy plants in Germany 2001-2023
Investments in renewable energy plants in Germany from 2001 to 2023 (in billion euros)
-
Premium Statistic
Total renewable energy capacity in South Africa 2013-2023

Total renewable energy capacity in South Africa 2013-2023
Total renewable energy capacity in South Africa from 2013 to 2023 (in megawatts)
-
Premium Statistic
Number of renewable power stations Japan 2023, by energy source

Number of renewable power stations Japan 2023, by energy source
Number of renewable electric power plants in Japan as of September 2023, by energy source
-
Premium Statistic
Renewable energy capacity in Italy 2008-2023

Renewable energy capacity in Italy 2008-2023
Renewable energy capacity in Italy from 2008 to 2023 (in megawatts)
-
Premium Statistic
U.S. renewable energy consumption 2023, by sector

U.S. renewable energy consumption 2023, by sector
Renewable energy consumption in the United States from 2005 to 2023, by sector (in trillion British thermal units)
-
Premium Statistic
Energy consumption from renewable energy - heating and cooling Germany 1990-2023

Energy consumption from renewable energy - heating and cooling Germany 1990-2023
Final energy consumption from renewable energy in the heating and cooling sectors* in Germany from 1990 to 2023 (in gigawatt hours)
-
Premium Statistic
New supply of new and renewable energy South Korea 2022, by source

New supply of new and renewable energy South Korea 2022, by source
New supply of new and renewable energy in South Korea in 2022, by source (in megawatts)
-
Premium Statistic
Renewable energy capacity share in Portugal 2011-2023

Renewable energy capacity share in Portugal 2011-2023
Share of renewable energy capacity in Portugal from 2011 to 2023
-
Premium Statistic
Reduced greenhouse gas emissions through using renewable energy Germany 2023

Reduced greenhouse gas emissions through using renewable energy Germany 2023
Volume of reduced greenhouse gas emissions through using renewable energy in Germany in 2023, by energy carrier (in million metric tons of CO₂) equivalent)
-
Premium Statistic
Global renewable energy consumption 2000-2022

Global renewable energy consumption 2000-2022
Renewable energy consumption worldwide from 2000 to 2022 (in exajoules)
-
Premium Statistic
Leading tech companies' renewable energy usage worldwide 2022

Leading tech companies' renewable energy usage worldwide 2022
Share of renewable energy used among leading tech companies worldwide in 2022, by company
-
Premium Statistic
Renewable energy consumption in Germany 1998-2022

Renewable energy consumption in Germany 1998-2022
Consumption of renewable energy in Germany from 1998 to 2022 (in exajoules)
-
Premium Statistic
Renewable energy consumption in Africa 2010-2022

Renewable energy consumption in Africa 2010-2022
Renewable energy consumption in Africa from 2010 to 2022 (in exajoules)
-
Premium Statistic
Renewable energy and biofuel supply in Greece 2021, by source

Renewable energy and biofuel supply in Greece 2021, by source
Supply of renewable energy and biofuels in Greece in 2021, by source (in million metric tons of oil equivalent)
-
Premium Statistic
Transport sector final energy consumption from renewable sources in Germany 1990-2023

Transport sector final energy consumption from renewable sources in Germany 1990-2023
Final energy consumption from renewable energy in the transport sector in Germany from 1990 to 2023 (in gigawatt hours)
-
Premium Statistic
Commercial renewable energy projects' installed capacity Philippines 2023, by type
Commercial renewable energy projects' installed capacity Philippines 2023, by type
Installed capacity of commercial renewable energy projects in the Philippines as of December 2023, by type (in megawatts)
-
Premium Statistic
New and renewable energy production volume South Korea 2021, by energy type

New and renewable energy production volume South Korea 2021, by energy type
Volume of new and renewable energy produced in South Korea in 2021, by energy type (in million toe)
-
Premium Statistic
Renewable energy and biofuel supply in Greece 2010-2021`

Renewable energy and biofuel supply in Greece 2010-2021`
Supply of renewable energy and biofuels in Greece from 2010 to 2021 (in million metric tons of oil equivalent)
-
Premium Statistic
Renewable energy capacity in India 2009-2023

Renewable energy capacity in India 2009-2023
Renewable energy capacity in India from 2009 to 2023 (in megawatts)
-
Premium Statistic
Renewable energy capacity in Mexico 2010-2023

Renewable energy capacity in Mexico 2010-2023
Renewable energy generation capacity in Mexico from 2010 to 2023 (in gigawatts)
-
Premium Statistic
Renewable energy capacity in Brazil 2010-2023

Renewable energy capacity in Brazil 2010-2023
Renewable energy generation capacity in Brazil from 2010 to 2023 (in gigawatts)
-
Premium Statistic
Renewable energy capacity in Peru 2010-2023
Renewable energy capacity in Peru 2010-2023
Renewable energy generation capacity in Peru from 2010 to 2023 (in megawatts)
-
Premium Statistic
Renewable energy capacity in Venezuela 2010-2023

Renewable energy capacity in Venezuela 2010-2023
Renewable energy generation capacity in Venezuela from 2010 to 2023 (in gigawatts)
-
Premium Statistic
Renewable energy capacity in Colombia 2010-2023

Renewable energy capacity in Colombia 2010-2023
Renewable energy generation capacity in Colombia from 2010 to 2023 (in gigawatts)
-
Premium Statistic
Renewable energy capacity in Argentina 2011-2023

Renewable energy capacity in Argentina 2011-2023
Renewable energy generation capacity in Argentina from 2011 to 2023 (in gigawatts)
-
Premium Statistic
Renewable energy capacity in the EU-27 2012-2023

Renewable energy capacity in the EU-27 2012-2023
Renewable energy generation capacity in the European Union from 2012 to 2023 (in gigawatts)
-
Premium Statistic
Renewable energy capacity installed in the UK 2022, by source

Renewable energy capacity installed in the UK 2022, by source
Cumulative installed capacity of renewable energy in the United Kingdom (UK) in 2022, by source (in megawatts)
-
Premium Statistic
Jobs in the renewable energy sector in Germany 2021, by technology

Jobs in the renewable energy sector in Germany 2021, by technology
Employment in the renewable energy sector in Germany 2021, by technology (in 1,000 jobs)
-
Premium Statistic
Number of renewable energy jobs in Chile 2022, by industry

Number of renewable energy jobs in Chile 2022, by industry
Number of renewable energy jobs in Chile in 2022, by industry (in 1,000s)
-
Premium Statistic
Renewable municipal waste energy capacity in Norway 2010-2023

Renewable municipal waste energy capacity in Norway 2010-2023
Renewable municipal waste energy capacity in Norway from 2010 to 2023 (in megawatts)
-
Premium Statistic
Renewable energy produced using photovoltaic power South Korea 2010-2022

Renewable energy produced using photovoltaic power South Korea 2010-2022
Volume of renewable energy produced using photovoltaic power in South Korea from 2010 to 2022 (in 1,000 toe)
-
Premium Statistic
Renewable municipal waste energy capacity in Sweden 2010-2023

Renewable municipal waste energy capacity in Sweden 2010-2023
Renewable municipal waste energy capacity in Sweden from 2010 to 2023 (in megawatts)
Further reportsGet the best reports to understand your industry
Get the best reports to understand your industry


Contact
Get in touch with us. We are happy to help.


Meredith Alda
Sales Manager– Contact (United States)
Mon - Fri, 9am - 6pm (EST)
Yolanda Mega
Operations Manager– Contact (Asia)
Mon - Fri, 9am - 5pm (SGT)
Kisara Mizuno
Senior Business Development Manager– Contact (Asia)
Mon - Fri, 10:00am - 6:00pm (JST)
Lodovica Biagi
Director of Operations– Contact (Europe)
Mon - Fri, 9:30am - 5pm (GMT)
Carolina Dulin
Group Director - LATAM– Contact (Latin America)
Mon - Fri, 9am - 6pm (EST)